
The Interstitial Fluid Illusion: Blood vs Extracellular Fluid Compartments
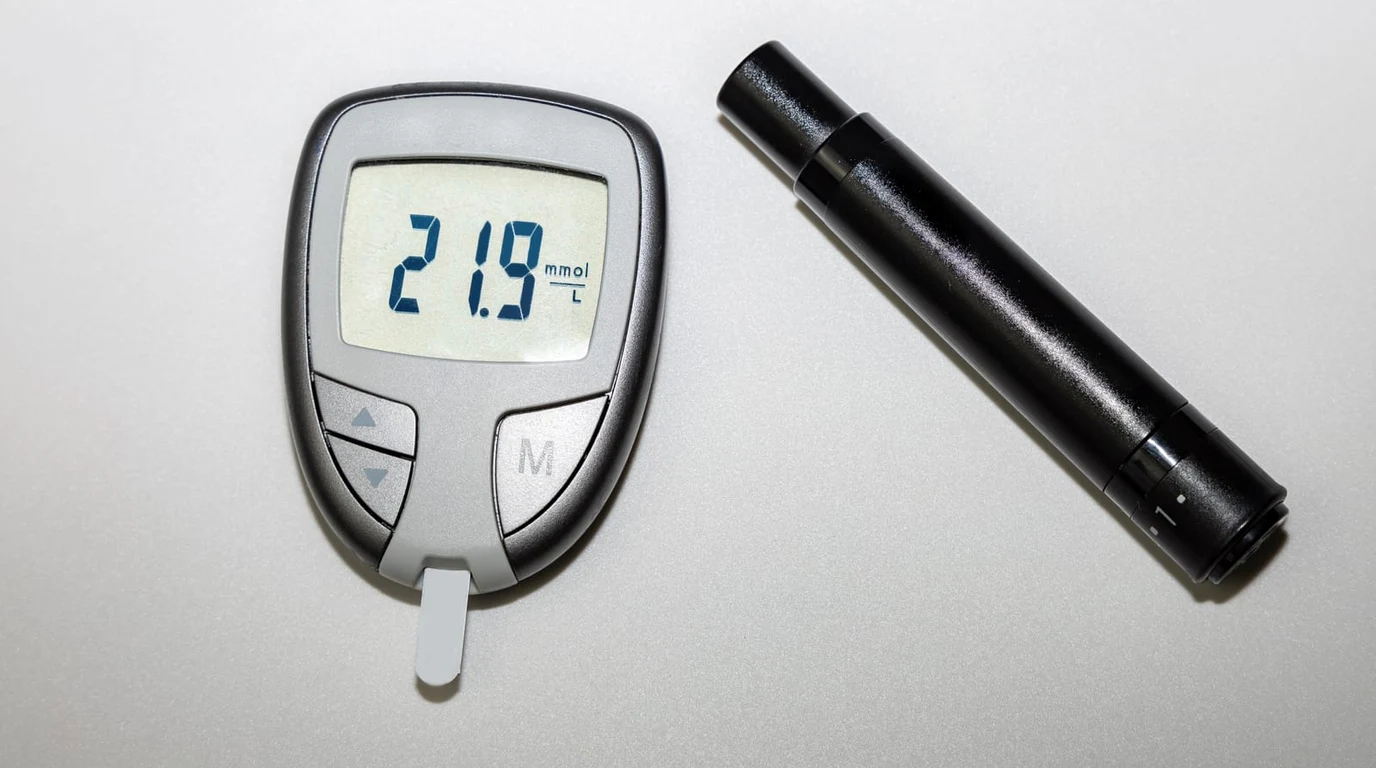
Millions of longevity enthusiasts, metabolic biohackers, and athletic performers have adopted Continuous Glucose Monitors (CGMs) like the Dexcom G7, Abbott FreeStyle Libre 3, and Signos biosensors. Yet, a universal moment of confusion occurs when a user consumes a carbohydrate-dense meal, checks their CGM reading (which reads 115 mg/dL), pricks their finger with a traditional blood glucometer (which reads 165 mg/dL), and assumes the CGM is fundamentally broken.
The CGM is not broken; the user has encountered the fundamental biophysical reality of interstitial fluid glucose diffusion kinetics. Understanding the fluid compartment dynamics between vascular capillary beds and extracellular tissue is critical for interpreting metabolic biosensor data with clinical precision.
Physiological Diffusion Lag: The Two-Compartment Pharmacokinetic Model
When glucose is ingested and absorbed across the intestinal enterocytes into the bloodstream, it enters the vascular compartment. Capillary blood delivers glucose rapidly through systemic circulation at high pressure and high flow velocity.
A CGM sensor filament does not sit inside a blood vessel. Inserting an indwelling catheter into an artery or vein creates immediate risks of thrombosis, infection, and mechanical shear. Instead, a CGM’s microscopic flexible enzymatic filament (typically 5mm to 8mm in length) is inserted into the subcutaneous adipose tissue layer. The sensor filament is completely submerged in interstitial fluid (ISF)—the extracellular fluid bath surrounding fat and muscle cells.
For glucose molecules to travel from systemic blood into the interstitial fluid where the CGM sensor can detect them, glucose must diffuse across the semipermeable vascular endothelial wall through a concentration gradient governed by Fick’s Law of Diffusion:
Where $J$ is diffusion flux, $D$ is the diffusion coefficient of glucose in biological tissue, and $dC/dx$ is the concentration gradient between capillary blood and interstitial fluid. This diffusion process is not instantaneous. In physiological steady-state conditions (such as fasting in the morning), capillary glucose and interstitial glucose concentrations are virtually identical. However, when blood glucose is changing rapidly—surging upward after a meal at $+3 ext{ mg/dL/min}$ or plummeting during high-intensity exercise at $-4 ext{ mg/dL/min}$—interstitial fluid lags behind capillary blood by 5 to 15 minutes.
| Biosensor Dimension | Capillary Fingerstick (BGM) | Continuous Glucose Monitor (CGM) |
|---|---|---|
| Sampled Biological Fluid | Capillary Whole Blood | Subcutaneous Interstitial Fluid (ISF) |
| Physiological Response Latency | 0 Minutes (Real-time vascular state) | 5 – 15 Minutes Diffusion Lag |
| Accuracy Standard (MARD / ISO) | ISO 15197:2013 (±15% of lab reference) | MARD: 7.9% – 8.8% (Clinical average) |
| Temporal Resolution | Isolated snapshots (3–6 discrete pricks/day) | Continuous (1 reading every 1 to 5 minutes) |
| Vulnerability to Compression Lows | None | High (Sleeping directly on sensor causes dips) |
| Primary Value Proposition | Confirming acute hypoglycemia / calibration | Glycemic variability, AUC, & dietary response |
MARD (Mean Absolute Relative Difference) Mathematics
In medical sensor engineering, the accuracy of continuous biosensors is quantified using the Mean Absolute Relative Difference (MARD) percentage compared to venous laboratory reference values (such as a YSI 2300 STAT Plus glucose analyzer):
A lower MARD score signifies higher biosensor precision. Modern generational breakthroughs have pushed CGM performance into institutional territory:
- Legacy First-Gen CGMs (Pre-2015): Exhibited MARD scores between 14% and 18%, requiring twice-daily fingerstick blood calibrations to correct for severe electrochemical baseline drift.
- Current Clinical Generation (Dexcom G7 / Abbott FreeStyle Libre 3): Achieve overall MARD scores between 7.9% and 8.6% across human clinical trials. These sensors are factory-calibrated during automated cleanroom assembly, eliminating mandatory fingerstick calibrations.
- Clinical Context: A MARD of 8.2% means that if your true lab reference venous glucose is 100 mg/dL, the CGM reading will, on average, fall within 91.8 mg/dL and 108.2 mg/dL.
The Nighttime Compression Low Artifact: Physical Micro-Vascular Occlusion
One of the most frequent false alarms experienced by non-diabetic biohackers is the 3:00 AM “nocturnal hypoglycemia crash,” where the CGM sounds an emergency alarm indicating blood sugar has plummeted to 52 mg/dL.
In over 90% of cases in healthy individuals, this is not true hypoglycemia; it is a mechanical compression low artifact. When an individual sleeps on their side, roll over, and pins the CGM sensor directly beneath their body weight against the mattress, two mechanical events occur:
- Local Capillary Ischemia: Direct physical pressure collapses the micro-capillaries supplying blood to the skin beneath the sensor, temporarily restricting fresh glucose delivery.
- Interstitial Fluid Squeeze: Mechanical compression pushes interstitial fluid out of the subcutaneous tissue bed, starving the enzymatic glucose oxidase electrode of extracellular fluid. Glucose readings plummet sharply within minutes.
- The Signature Recovery Curve: The moment the sleeper rolls off the sensor, interstitial fluid rushes back into the tissue, and CGM glucose immediately shoots upward by 30 to 40 mg/dL in a vertical straight line—a physical trajectory that is biologically impossible in human metabolic physiology.
The Strategic Integration: How Biohackers Should Deploy Both Tools
Neither tool replaces the other; they serve completely distinct diagnostic purposes in metabolic longevity architecture.
A fingerstick blood glucometer provides a high-precision, zero-lag single-frame photograph. It is indispensable for verifying unexpected extreme highs, diagnosing suspected true hypoglycemia symptoms (tremors, diaphoresis, tachycardia), and verifying sensor accuracy during the first 12 hours of CGM sensor warm-up when enzymatic baseline stabilization is occurring.
A CGM provides the continuous motion picture. Even if an individual fingerstick reading is off by 8% due to diffusion lag, the CGM reveals the rate of change (velocity vectors), the Area Under the Curve (AUC), and Glycemic Variability (Standard Deviation / Coefficient of Variation). It unmasks the silent glycemic damage caused by hidden food additives, chronic sleep deprivation, and psychological stress spikes that a static fingerstick taken three times a day could never detect.
To analyze the impact of nocturnal glucose stability on sleep quality, review our forensic investigation on continuous ketone monitoring vs breath sensors, and check our comparative benchmark on Dexcom G7 vs FreeStyle Libre 3 sensor accuracy for non-diabetics.
\nBefore evaluating overnight glycemic variability curves, examine capillary blood fingerstick calibration mechanics. Review our forensic MARD study: CGM Compression Lows: Overnight False Hypo Forensics.