
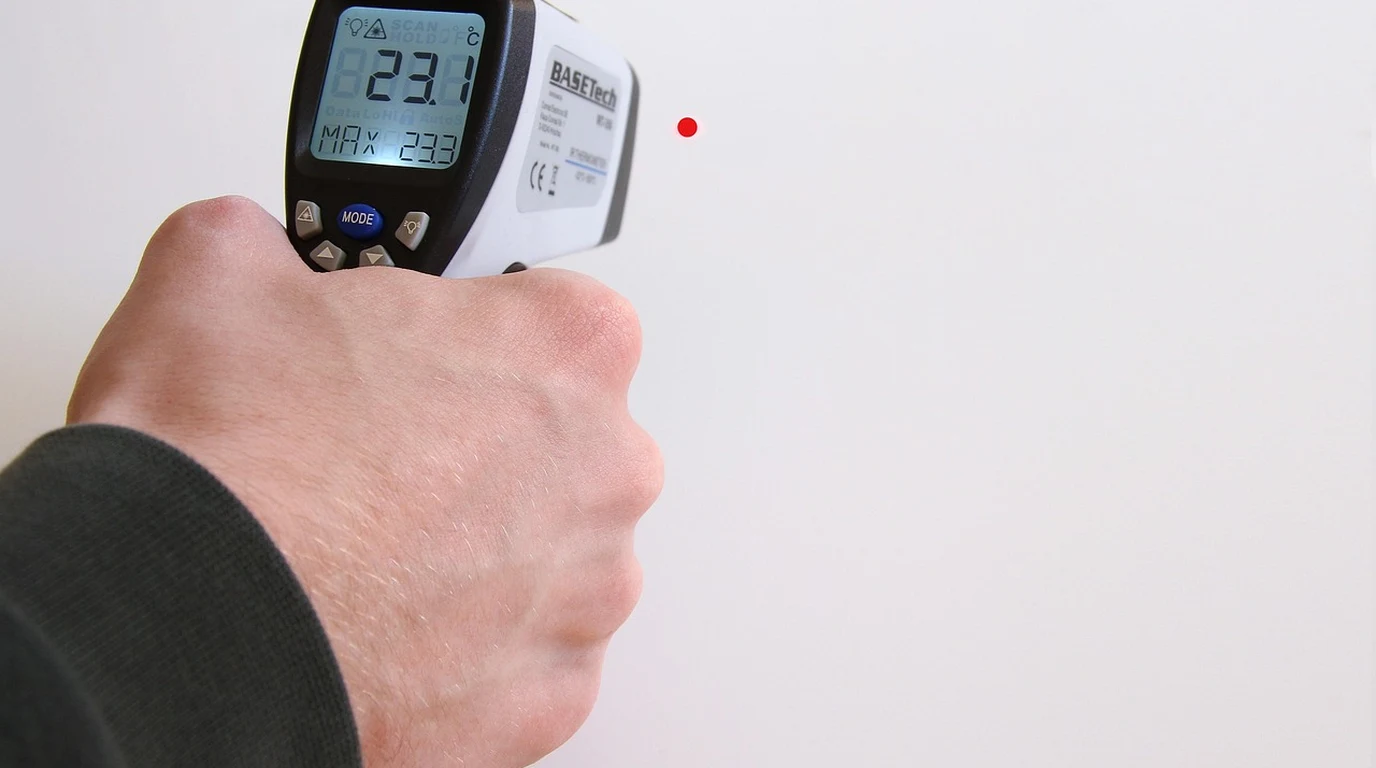
If you’ve spent any time in the biohacking or light therapy communities over the past five years, you’ve seen the impressive claims on red light panel product pages: *”100 mW/cm² at 6 inches!”*, *”120 mW/cm² of ultra-high power output!”*, or even *”150 mW/cm² for deep tissue penetration!”*
You might have even bought a $50 solar power meter from Amazon, held it six inches from your panel, watched the digital readout jump to 110 mW/cm², and felt a wave of validation.
Here is the uncomfortable truth: that reading is an optical illusion.
You are likely getting less than half the light energy you think you are. The consumer photobiomodulation (PBM) industry has spent years running an unannounced marketing campaign built on a fundamental optical physics error: measuring narrow-band LED light arrays with low-cost broadband solar meters calibrated exclusively for sunlight.
Direct Practical Verdict:
If you rely on inflated irradiance metrics, your treatment doses will be wildly inaccurate. You will either under-dose your mitochondria and wonder why your systemic recovery has plateaued, or unknowingly over-dose into the inhibitory side of the biphasic dose-response curve—causing cellular fatigue, oxidative stress, and treatment failure.
Let’s sit down, pour a fresh cup of coffee, and dismantle the optical physics, sensor mechanics, and biological consequences behind the red light irradiance inflation scandal.
—
## Why Are Consumer Red Light Panel Manufacturers Claiming 100+ mW/cm²?
To understand how we arrived at this state of optical metric inflation, we have to look back at the origins of consumer photobiomodulation around 2016 to 2018.
In clinical research laboratories, light therapy was originally administered using high-precision, low-level laser therapy (LLLT) devices or tightly controlled, custom-built LED arrays. Researchers were meticulous about power density, using calibrated laser power meters and thermal thermopile sensors to calculate exact photon delivery to tissue culture dishes or target skin areas.
When the market shifted to direct-to-consumer LED panels, manufacturers suddenly faced an arms race. Consumers wanted the “strongest” panel on the market, operating under the simplified assumption that more light intensity automatically equaled faster healing, higher collagen synthesis, and deeper joint penetration.
Manufacturers needed a quick, cheap, and visual way to demonstrate high irradiance on camera and in marketing videos. Laboratory-grade optical spectroradiometers and NIST-traceable power meters cost anywhere from $2,500 to $25,000 and require skilled optical technicians to operate.
Enter the hand-held solar power meter—most notably models like the Tenmars TM-206, TES 1333, and Solar Light 3.0.
“`
+———————————————————————–+
| THE IRRADIANCE SCANDAL |
| |
| [ Panel Output ] —> [ Solar Power Meter ] —> Reads: 120 mW/cm² |
| (TM-206) (FALSE INFLATION) |
| |
| [ Panel Output ] —> [ Spectroradiometer ] —> Reads: 42 mW/cm² |
| (Thorlabs/Ocean) (TRUE OPTICAL POWER)|
+———————————————————————–+
“`
These devices were engineered for a completely different industry: solar energy installation. Solar technicians use them to measure broad-spectrum sunlight hitting solar panels on roof tops to estimate photovoltaic power generation. They cost around $40 to $70, fit in a pocket, and feature a bold digital display reading in Watts per square meter ($W/m^2$) or milliwatts per square centimeter ($mW/cm^2$).
Marketing teams quickly realized something astonishing: when you put a $50 solar meter in front of a 660nm red and 850nm near-infrared LED panel, the reading jumps to numbers like 100, 120, or even 150 mW/cm².
It looked impressive. It looked scientific. It allowed brands to out-spec their competitors overnight without upgrading a single LED chip or power supply.
The problem? The math built into that cheap handheld meter is fundamentally incapable of processing monochromatic LED light.
—
## What Is the Optical Physics Behind Solar Meter vs Sensor Differences?
To understand why a solar meter lies to you, we have to examine the physics of photo-detectors, spectral responsivity, and spatial integration.
### 1. The Spectral Responsivity ($R_\lambda$) Mismatch
Every silicon photodiode has a property known as spectral responsivity, denoted as $R(\lambda)$. This metric defines how many Amperes ($A$) of electric current the sensor generates for every Watt ($W$) of incident light at a specific wavelength ($\lambda$).
$$R(\lambda) = \frac{I_{photocurrent} \text{ (Amps)}}{P_{optical} \text{ (Watts)}}$$
Sunlight is a broad, continuous spectrum stretching from ultraviolet (280nm) through the visible light spectrum and deep into the short-wave infrared (up to 2500nm). A solar meter contains a low-cost silicon sensor whose internal firmware applies a fixed optical conversion factor based on the solar spectral power distribution—specifically the ASTM G173 AM1.5 Standard Solar Spectrum.
The meter’s processor assumes that the light hitting its sensor is distributed across the entire solar spectrum. It takes the total photocurrent generated by the photodiode and multiplies it by a hardcoded conversion algorithm designed specifically for sunlight.
“`
Solar Spectrum (Continuous Broad Spectrum) vs LED Spectrum (Monochromatic Peaks)
Relative Intensity
^
1.0| /—\ <-- Solar Spectrum (AM1.5) - Broad distribution across 400-1100nm+
| / \
0.5| / \ /\ 660nm /\ 850nm <-- Narrowband LED Peaks
| / \ / \ / \ (FWHM ~20nm)
0.0+--+-----------+------/----\------/----\--------------------------> Wavelength (nm)
300 500 600 700 800 900 1000
“`
When you point that meter at a red light therapy panel, you are not hitting it with sunlight. You are hitting it with narrow-band, high-intensity monochromatic light—typically dual peaks centered tightly at 660nm (Red) and 850nm (Near-Infrared) with a Full-Width at Half-Maximum (FWHM) of only 20 to 30 nanometers.
Because silicon photodiode responsivity peaks sharply in the near-infrared region (around 800nm–900nm), the monochromatic LED photons generate a massive spike in photocurrent. The solar meter’s internal algorithm, still assuming it is measuring diffuse sunlight, applies its standard solar multiplication factor to this massive photocurrent spike.
The result? An artificial 200% to 300% multiplication of the real optical output. A panel delivering a true 40 mW/cm² of optical power triggers a readout of 110 mW/cm² on a solar meter simply because the meter’s internal firmware misinterprets the sensor’s current spike.
### 2. Angular Response and Cosine Error ($\cos \theta$)
Light emitted from a solar panel or the sun overhead hits surfaces with a wide Lambertian distribution. Standard solar meters are equipped with crude plastic diffusers designed to integrate light arriving from broad angles across the sky.
In contrast, consumer red light panels utilize secondary optical lenses mounted directly over each LED—typically 30°, 60°, or 90° beam angles. These lenses concentrate light into narrow, directed beams to maximize forward projection.
“`
LIGHT BEAM BEHAVIOR & SENSOR RESPONSE
Panel LED with 30° Lens Flat Solar Meter Diffuser
\ | / +—————+
\ | / <-- Concentrated | Uncalibrated| -> Severe internal reflections
\ | / Angled Beams | Flat Sensor | & incorrect integration
\|/ +—————+
“`
When high-angle, concentrated LED light hits a solar meter’s flat plastic diffuser:
* A portion of the light suffers unmeasured internal reflection off the flat cover.
* The sensor lacks a calibrated Lambertian Cosine Corrector, causing severe spatial integration errors.
* Photons striking off-axis are either under-counted or abnormally reflected inside the housing, destroying any possibility of repeatable, spatially accurate spatial power density measurement.
### 3. Thermal Drift & Semiconductor Bandgap Changes
High-power LED panels generate significant thermal energy. A standard 300-Watt panel packs multiple internal cooling fans to heat-sink its circuit board.
When you place a solar meter 6 inches away from a panel, the meter is exposed not only to light, but to convective heat and radiated heat from the housing. Low-cost silicon photodiode sensors lack thermal stabilization (such as a thermoelectric Peltier cooler).
As a silicon sensor heats up:
1. Its semiconductor bandgap energy ($E_g$) slightly narrows.
2. Its long-wavelength cutoff shifts further into the infrared spectrum.
3. Dark current increases exponentially.
This means that after just 60 seconds of exposure, a solar meter’s sensor begins drifting upward purely from thermal absorption, registering higher “irradiance” numbers simply because the meter itself is getting warm.
### 4. How Laboratory Equipment Solves This
Laboratory-grade measurement setups do not rely on crude broadband conversion routines. They employ two primary methods:
* NIST-Traceable Thermal Thermopile Sensors (e.g., Thorlabs PM100D with S401C Head): Thermopiles do not rely on photodiode quantum efficiency curves. Instead, they measure actual absorbed thermal power across a spectrally flat absorber disc. Whether the photon is 400nm, 660nm, or 1060nm, 1 Watt of light energy creates the exact same thermal delta, completely eliminating spectral responsivity errors.
* Array Spectroradiometers with Integrating Spheres (e.g., Ocean Insight / Maya2000 Pro): Light is collected inside a PTFE-coated (Pfeiffer/Spectralon) integrating sphere that scatters photons into a perfectly uniform spatial distribution. The light is transferred via optical fiber to a spectroradiometer, which breaks the light down nanometer-by-nanometer, measures actual photon counts at every wavelength, and calculates absolute spectral irradiance ($mW/cm^2/nm$) using calibrated NIST source files.
“`
+———————————————————————————–+
| LABORATORY SPECTRORADIOMETER DETECTOR SYSTEM |
| |
| [ Panel Output ] —> [ Integrating Sphere ] —> [ Fiber Optic ] —> Spectro- |
| (Lambertian Scattering) Cable meter |
| | |
| NIST Calibration |
| Math Engine ($mW$) |
+———————————————————————————–+
“`
When independent optical labs test consumer panels using integrating spheres and spectroradiometers, the results are startling:
* Panel A: Claimed Irradiance: 120 mW/cm² | Real Spectroradiometer Irradiance: 42 mW/cm²
* Panel B: Claimed Irradiance: 100 mW/cm² | Real Spectroradiometer Irradiance: 38 mW/cm²
* Panel C: Claimed Irradiance: 150 mW/cm² | Real Spectroradiometer Irradiance: 51 mW/cm²
On average, consumer solar meter readings overstate true optical power density by 150% to 250%.
—
## How Does Inflated Irradiance Ruin Your Photobiomodulation Dosing?
Why should you care if a manufacturer uses a solar meter to boast about high numbers, as long as the light works?
The answer lies in the fundamental law of photobiology: The Arndt-Schulz Law and the Biphasic Dose-Response Curve.
In photobiomodulation, light energy acts much like a pharmaceutical agent. There is a sub-therapeutic threshold, an optimal therapeutic window, and an inhibitory/toxic threshold.
“`
THE BIPHASIC DOSE-RESPONSE CURVE
(Arndt-Schulz Law in Action)
Biological
Response
^
| Optimal Window
| (4 – 10 J/cm²)
MAX | /\
| / \
| / \
| Sub- / \ Inhibitory Zone
| Therapeutic / \ (ROS Toxicity / CCO Shutdown)
| Zone / \ \
+————–/————\——-\——————-> Target Dose
0 5 10 15 20+ (Joules/cm²)
“`
The biological receptor for red and near-infrared light is primarily Cytochrome c Oxidase (CCO), Complex IV of the mitochondrial electron transport chain. When photons of appropriate wavelengths (630–670nm and 810–850nm) strike CCO:
1. They displace inhibitory Nitric Oxide (NO).
2. They increase mitochondrial membrane potential ($\Delta\Psi_m$).
3. They stimulate Adenosine Triphosphate (ATP) production.
4. They generate a transient, micro-burst of Reactive Oxygen Species (ROS) that triggers downstream anti-inflammatory and cellular repair signaling pathways.
However, if you deliver too many photons to the tissue, the system reverses. Excessive optical power overwhelms the mitochondrial antioxidant defenses, causes mitochondrial membrane hyperpolarization, triggers massive unwanted ROS bursts, inactivates Cytochrome c Oxidase, and causes cellular photo-inhibition.
### The Dosing Equation
Energy Density—the actual “dose” of light delivered to your skin—is measured in Joules per square centimeter ($J/cm^2$). The relationship between power intensity and time is calculated using this fundamental formula:
$$\text{Energy Density } (J/cm^2) = \frac{\text{Irradiance } (mW/cm^2) \times \text{Time } (seconds)}{1000}$$
Let’s look at what happens when you calculate your treatment regimen using a solar meter’s inflated reading versus true optical reality.
#### Scenario A: The Under-Dosing Trap (The Most Common Outcome)
Suppose a peer-reviewed research study demonstrates that targeted knee joint pain relief requires an actual absorbed energy density of 8 $J/cm^2$ at the tissue level.
You check your red light panel manual. The manufacturer claims an irradiance of 100 mW/cm² at 6 inches (measured via solar meter).
You calculate your treatment duration to hit your target $8 \, J/cm^2$ dose:
$$\text{Time } (seconds) = \frac{\text{Dose } (J/cm^2) \times 1000}{\text{Irradiance } (mW/cm^2)}$$
$$\text{Time} = \frac{8 \times 1000}{100} = 80 \text{ seconds (1 minute 20 seconds)}$$
You set your timer for 80 seconds, convinced you’ve delivered a precise therapeutic dose.
The Reality Check:
Because the panel’s true optical output is only 35 mW/cm², let’s calculate the dose you actually received in those 80 seconds:
$$\text{Actual Dose} = \frac{35 \times 80}{1000} = 2.8 \text{ } J/cm^2$$
Instead of receiving an optimal clinical dose of $8 \, J/cm^2$, you received just 2.8 $J/cm^2$—a sub-therapeutic dose that barely penetrates skin layers and completely fails to reach deep joint cartilage or target muscle tissue.
You use the panel for three months, see zero relief, and conclude that “red light therapy doesn’t work.” In reality, photobiomodulation failed simply because your optical math was wrong.
#### Scenario B: The Over-Dosing Trap (Cellular Exhaustion)
Now let me show you the opposite scenario, which is equally problematic for home users.
Assume an aggressive biohacker wants to target deep quadriceps recovery after heavy resistance training. They aim for a deep-tissue target dose of 30 $J/cm^2$.
Knowing that deeper tissues attenuate light rapidly, they decide to sit closer to the panel or increase treatment time. If they believe their panel delivers 100 mW/cm², they might run a 15-minute treatment session per side ($900 \text{ seconds}$).
If their panel happens to be one of the rare high-output arrays actually delivering a true 70 mW/cm² at close proximity (3 inches), look at the dose delivered over 15 minutes:
$$\text{Actual Dose} = \frac{70 \times 900}{1000} = 63 \text{ } J/cm^2$$
A dose of $63 \, J/cm^2$ drives tissue directly off the peak of the Arndt-Schulz curve and deep into the inhibitory toxicity phase.
Rather than walking away with increased ATP production and cellular repair, the mitochondria suffer photo-inhibition. The biohacker experiences unexplainable systemic fatigue, skin redness, delayed recovery, and increased inflammation—the exact opposite of their intended outcome.
—
## Comparing Irradiance Testing Technologies
To navigate device specs effectively, you need to understand how different testing tools compare. The matrix below breaks down the technical differences between cheap consumer solar meters, photodiode laboratory heads, thermal thermopiles, and spectroradiometer systems.
Consumer red light panels claiming 100–150 mW/cm² measured with $50 solar meters (like the Tenmars TM-206) overstate actual irradiance by 2x to 3x. Solar meters miscalibrate narrow-band LEDs, mistaking peak LED wavelengths for broad spectrum sunlight. True lab-grade spectroradiometer tests reveal actual therapeutic optical power is typically 35–55 mW/cm², requiring recalibrated dosing times to avoid treatment failure.
|
Irradiance Measurement Protocols & Optical Spectrometry
Validating true optical power density is critical when scaling from compact localized LED arrays to whole-body systems. For solar meter vs spectrometer tests, see Red Light Therapy Beds vs Panels: Full Body Math. |
|---|